


Income Statement - Free Excel Download

Financial Statements: The Income Statement
Income statements show the results of a company’s operations, which are usually given quarterly or by fiscal year. It shows the sales, also known as revenue, and expenses. It also shows whether the company had a profit or loss during that period. The Income Statement is also known as the “Profit & Loss” statement or “P&L.” Simply put, the formula is: “Revenue – Expenses = Income.” The easiest and best scenario is, “The higher the sales and the lower the expenses, the greater the income.” There are all types of expenses that are generated in a company and this statement sees how the company is spending its money, and how management is most and least effective.
As previously described, the Balance Sheet shows the value in the company’s accounts at a certain period, whereas the Income Statement covers operations over an entire period.
The income statement gives you the “Net Income,” also known as “The Bottom Line,” after all costs and expenses have been subtracted from all possible income including total sales, interest earned on investments, and sale of a non-tangible item like a patent.
Here is a brief explanation of the type of accounts associated with a common Income Statement:
Revenues – also called “Sales, “Sales Revenue,” or “Sales of Goods or Services.” It is also known as the “Top Line.” It is the amount of money the company made, before any expenses, on its operations. This, however, would not pertain to any income made from selling plant equipment or interest on marketable securities, etc. When applicable, income other than what is considered revenue is shown in “Other Income or Interest Income.”
Cost of Goods Sold – also known as, and pronounced, “COGS” or “Cost of Sales” – These are direct costs or direct expenses because they are directly associated with making what the company sells (i.e. manufacturer), cost directly associated with the service the company supply’s (i.e. Internet Service Provider), or what a company would pay for merchandise it sells in stores (i.e. retailer). For example:
- If the company were a manufacturer, the COGS would be the cost of materials and the wages for those making the product, along with the factory operational costs associated with the product like freight and transportation, rent, power, lights, maintenance, etc.
- If the company is a service-related business, COGS represents the cost of services rendered or cost of revenues.
- If the company were a retailer then the COGS would be the price paid to the suppliers for the merchandise it sells in the stores, including the transportation costs of getting the goods into the stores.
Gross Income – also called “Gross Profit.” It is the money the company earns on its sales before SG&A.
Selling, General, and Administrative Expense also known as “SG&A” – It is the salary of the sales people and the commissions, sales expenses, marketing expenses, managers salaries and benefits, office expenses like the power, lights, rent, supplies, and everything else needed to run a company. This also includes the cost of the supporting departments like HR, IS, Finance, etc. Basically SG&A is all costs that are not directly producing the product, or after a retailer buys a product from a supplier, as described in COGS above.
Operating Income Before Depreciation - This is gross income or gross profit minus SG&A. This is also the EBITDA number. For more information on EBITDA, see the related ratio explanations later in this lesson.
Depreciation Expense – This is the amount of depreciation charged against sales during the period. This is not the same as accumulated depreciation on the balance sheet, as that is the total of all past depreciation. This depreciation expense will be on the income statement, and also added to the accumulated depreciation on the balance sheet at the beginning of the period.
Operating Income – Gross income minus SG&A gives you the operating income. This is also considered EBIT or operating profit. For more information on EBIT, see the related ratio explanations later in this lesson.
Interest Expense – This item reflects the costs of a company's borrowings.
Non-operating Income – An example of this would be money won from a lawsuit. Another example would be interest made on marketable securities. This is also called extraordinary or nonrecurring income.
Non-operating Expenses – This could be the cost of litigation or settlements paid in lawsuits, closing down a division, etc.
Pre-Tax Accounting Income – Also known as “Income Before Taxes.” This is the income before taxes.
Provision for Income Taxes – Taxes that will be charged against the income in this period, even if they have not been paid in this period. This will be the income tax charged to income for the period.
Income before Extraordinary Items – This is the pre-tax minus income tax.
Preferred Stock Dividends - Each share of preferred stock is normally paid a guaranteed, relatively high dividend and has first dibs over common stock at the company's assets in the event of bankruptcy. In exchange for the higher income and safety, preferred shareholders miss out on large potential capital gains (or losses). Owners of preferred stock generally do not have voting privileges
Net Income Available to Common Stockholders - The net income applicable to common shares figure is the bottom-line profit the company reported. To get the basic earnings-per-share [Basic EPS] figure, analysts divide the net income applicable to common by the total number of shares outstanding.
Extraordinary items - Are events that occur infrequently and are unusual. They can include acts of God as long as they rarely occur in the area where the business operates.
Discontinued operations - Occur when a significant segment of a business has been identified for disposal. Once so identified, any gain or loss from operations of the segment while it is being disposed of and any gain or loss on the sale of the assets of the segment, are reported separately from the remaining, continuing operations.
Net Income or (Loss) – This is also known as, “The Bottom Line.” Net income is what’s left after subtracting the COGS, SG&A, and all the rest of the expenses and taxes on the income statement. Of course, if expenses exceed income, this account caption will read as a net loss. The dollar amount would be in parentheses and/or in red. For more information, see the related ratio explanations later in this lesson.
*Comprehensive Income is fairly new (1998) and takes into consideration the effect of such items as foreign currency translations adjustments, minimum pension liability adjustments, and unrealized gains/losses on certain investments in debt and equity.
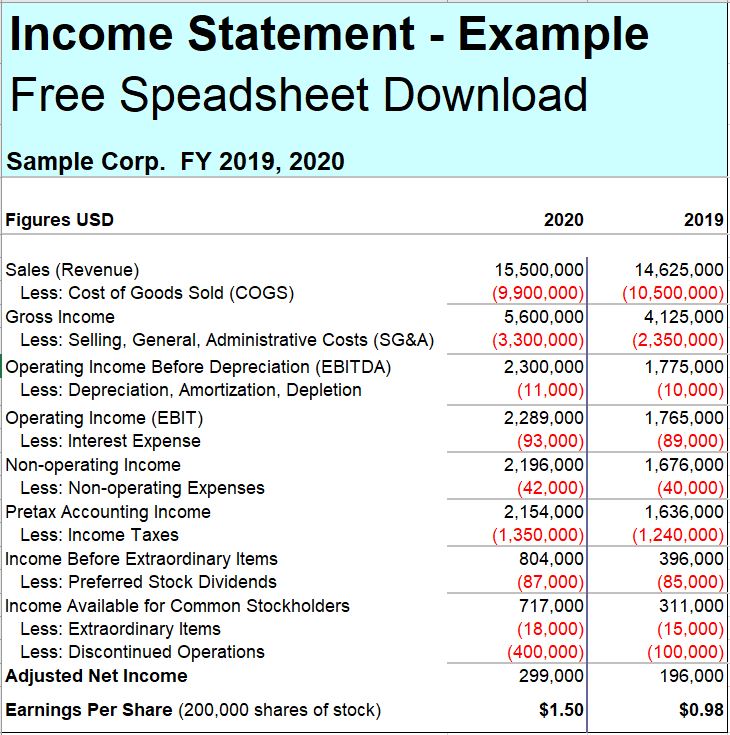
Earnings Per Share (EPS) - This is Net income remaining for stockholders ÷ Common shares outstanding, also considered part of the bottom line. In this example for 2020, $299,000 (Net income) ÷ 200,000 (200,000 shares of stock) = $ 1.50 per share.
Income statements are like a management report card. It lets you investigate where sales are rising or falling, whether costs are rising or falling faster or slower than sales, if interests expense is rising or falling year to year, of if there were any extraordinary changes, etc. For example:
- A manager of a department who produces a product can do their part by keeping control of COGS by always being aware, and trying to reduce, the cost of materials, parts, hardware, etc.
- A manager of customer service would be able to reduce their part in SG&A by reducing overtime, unnecessary office space expansion, supplies, etc.
- Also, you can do a basic calculation on revenue per employee (divide the revenues by the total number of employees), and calculate the net income per employee (divide the net income by the number of employees). If you see a downward trend, then it could mean that the company is not effectively managing its employees.

 | ||||